21 The Proportional Hazards Property
21.1 Definition
Under proportional hazards, the relative risk \(h_2(t)/h_1(t) = \psi\) is constant over time. Group 2 is always \(\psi\) times as likely to experience the event as group 1, regardless of how long they have survived.
Equivalent conditions: \[ H_2(t) = \psi\, H_1(t) \qquad \Leftrightarrow \qquad S_2(t) = S_1(t)^\psi. \]
21.2 Weibull and exponential models satisfy PH
For a Weibull model with common shape \(\gamma\) and rates \(\lambda_1, \lambda_2\): \[ h_j(t) = \lambda_j \gamma t^{\gamma-1}, \qquad \frac{h_2(t)}{h_1(t)} = \frac{\lambda_2}{\lambda_1} = \psi. \] The hazard ratio is \(\psi = \lambda_2/\lambda_1\) and does not depend on \(t\). The exponential model is the special case \(\gamma = 1\).
Not all distributions satisfy PH. For example, the log-normal and gamma distributions generally do not.
21.3 Graphical assessment
Taking \(\log\) of \(H_j(t) = \lambda_j t^\gamma\): \[ \log H_j(t) = \log\lambda_j + \gamma\log t. \]
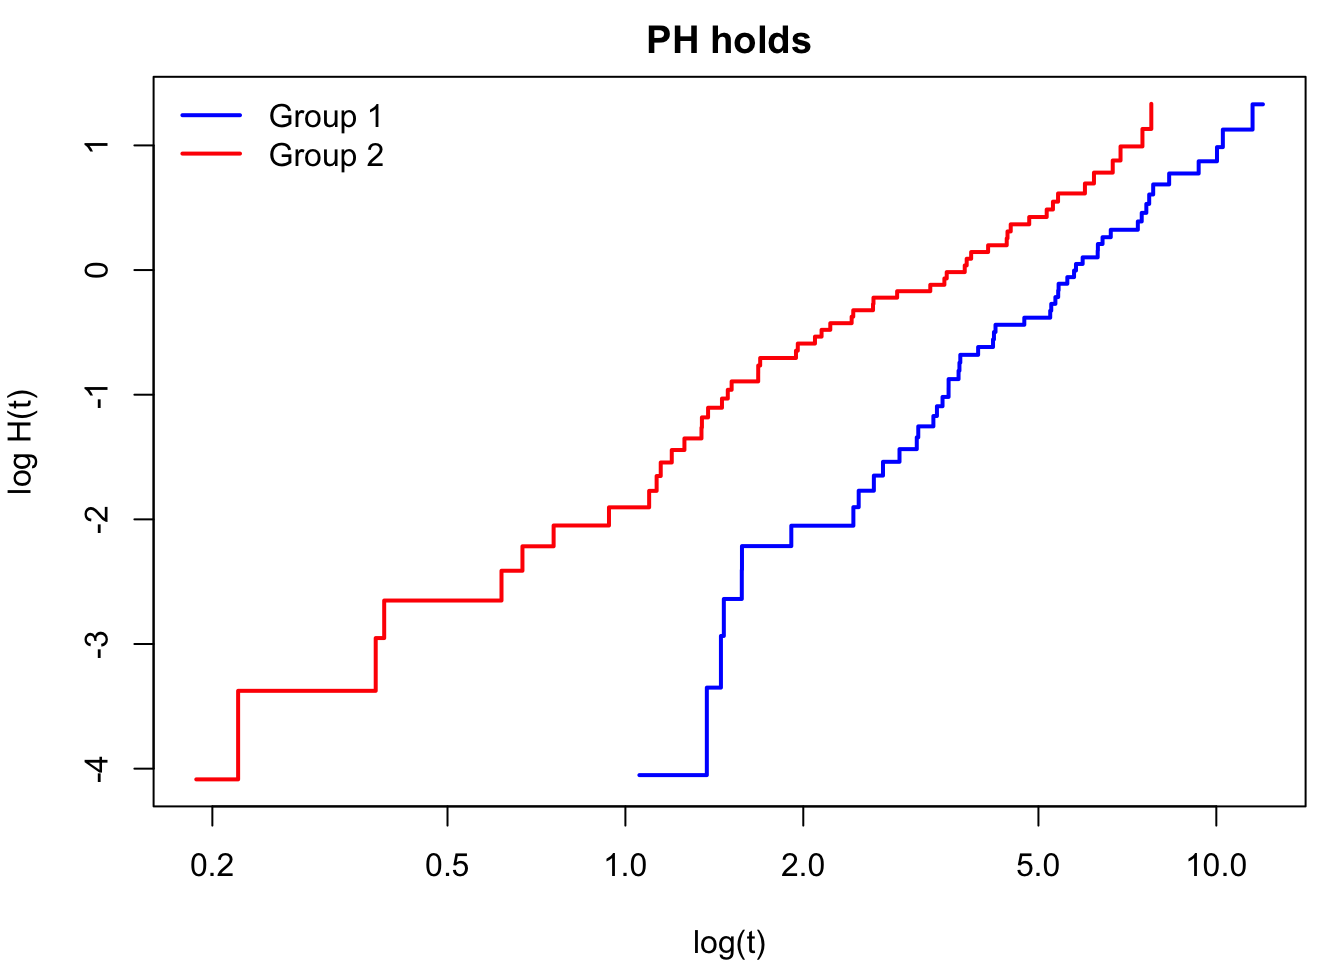
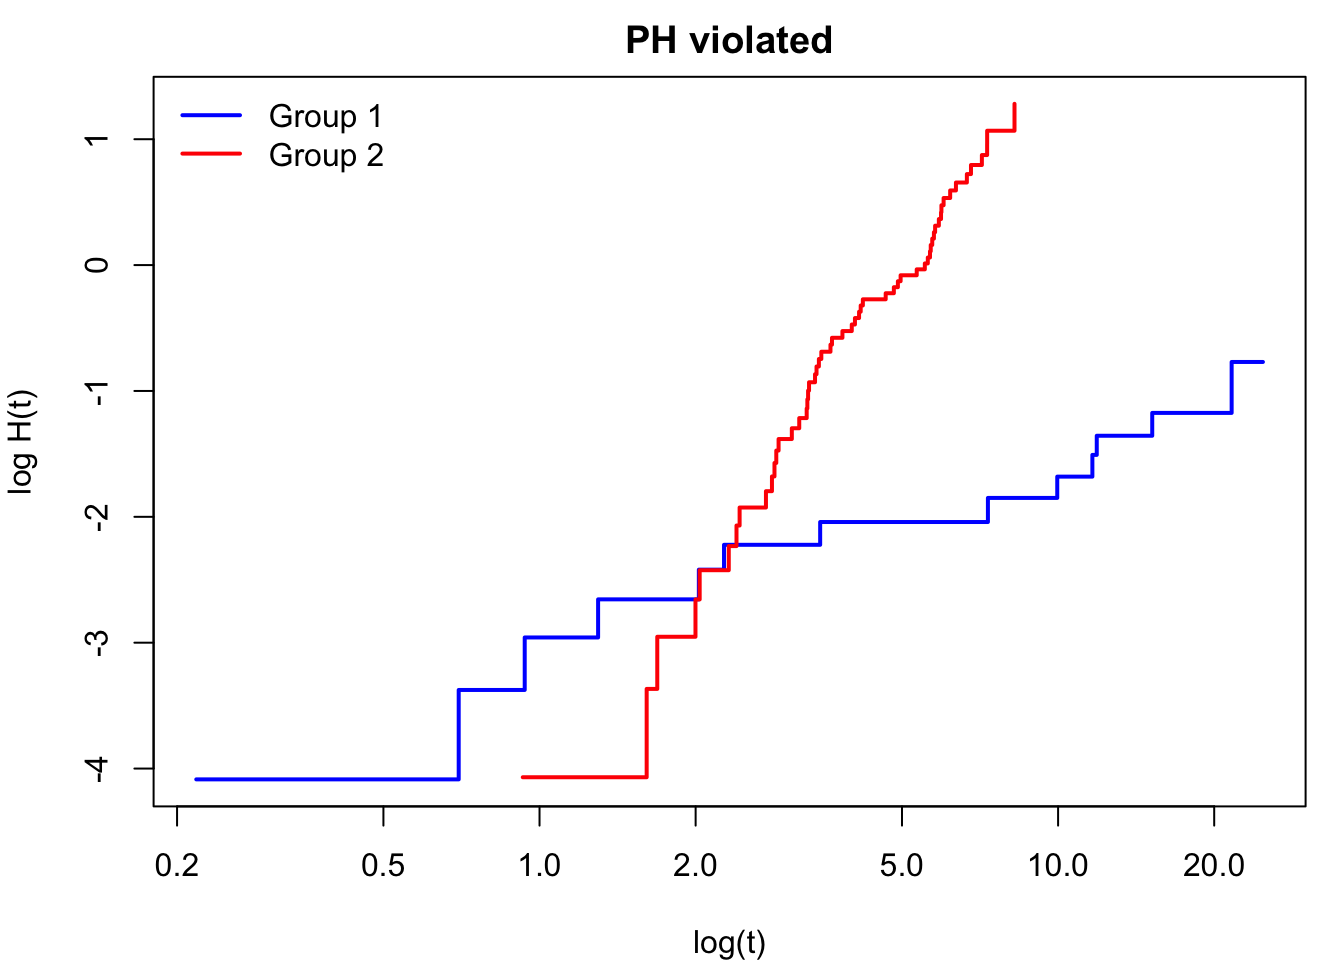
If the PH property holds, the log-cumulative hazard plots for the two groups should be parallel lines. The vertical distance between them is \(\log\psi = \log\lambda_2 - \log\lambda_1\).
Equivalently, plotting \(\log\widehat{H}(t)\) (computed from the Kaplan–Meier estimator) against \(\log t\) for each group provides both:
- A Weibull fit check: the curves should be linear.
- A PH assumption check: the curves should be parallel.
21.4 Prognostic index
In a multiple regression setting (several explanatory variables \(\mathbf{x} = (x_1, \ldots, x_p)\)), the PH model takes the form \[ h(t \mid \mathbf{x}) = h_0(t) \exp(\bbeta^T \mathbf{x}), \] where \(h_0(t)\) is the baseline hazard (the hazard when all explanatory variables are zero) and \(\bbeta = (\beta_1, \ldots, \beta_p)^T\) is the parameter vector.
The quantity \(\bbeta^T \mathbf{x} = \beta_1 x_1 + \cdots + \beta_p x_p\) is called the prognostic index or linear predictor. Individuals with larger prognostic indices have higher hazard.
Hazard ratio for two individuals with vectors of explanatory variables \(\mathbf{x}\) and \(\mathbf{x}^*\): \[ \frac{h(t \mid \mathbf{x})}{h(t \mid \mathbf{x}^*)} = \exp\!\bigl(\bbeta^T(\mathbf{x} - \mathbf{x}^*)\bigr), \] which is constant in \(t\): the PH property holds for any combination of explanatory variables.
For a single binary explanatory variable (\(x = 0\) or \(1\)), the hazard ratio is \(\psi = e^\beta\).
Exercises
21.1. For each of the following hazard functions, determine whether the proportional hazards (PH) property holds. Recall that a family \(\{h(t;\bbeta)\}\) has the PH property if multiplying the hazard by any positive constant \(\psi\) yields another hazard in the same family.
(i) Gompertz: \(h(t) = \lambda e^{\theta t}\), \(\lambda > 0\), \(\theta \in \mathbb{R}\).
- Does the Gompertz distribution have the PH property?
(ii) Makeham: \(h(t) = \gamma + \lambda e^{-\theta t}\), \(\gamma > 0\), \(\lambda \geq -\gamma\), \(\theta \geq 0\).
- Does the Makeham distribution have the PH property?
(iii) Bathtub: \(h(t) = \alpha t + \beta/(1+\gamma t)\), \(\gamma \geq 0\), \(\alpha \geq 0\), \(\beta > 0\).
- Does the Bathtub distribution have the PH property?
For each case that has the PH property, explicitly show how the reparametrisation works: write \(\psi h(t)\) in the original functional form with new parameter values.